Commodity IQ
Update CIQ Sub- Group Layouts
We've updated the CIQ layouts to better align with how you read the Commodity IQ material. The data order has been improved, and we've added tabs for a more seamless experience.
On the main Sub-Group page, items are now organized into four different tabs (active if data is available):
-
Demand: Demand Index and Demand Analysis (formerly Market Overview)
-
Lead Time & Inventory: Lead Time Index, Lead Time Weeks Trend, Lead Time Analysis, Inventory Index
-
Pricing: Price Index, Pricing Analysis
-
Design: Design Index
*Tabs will be grayed-out if no data is available for that section.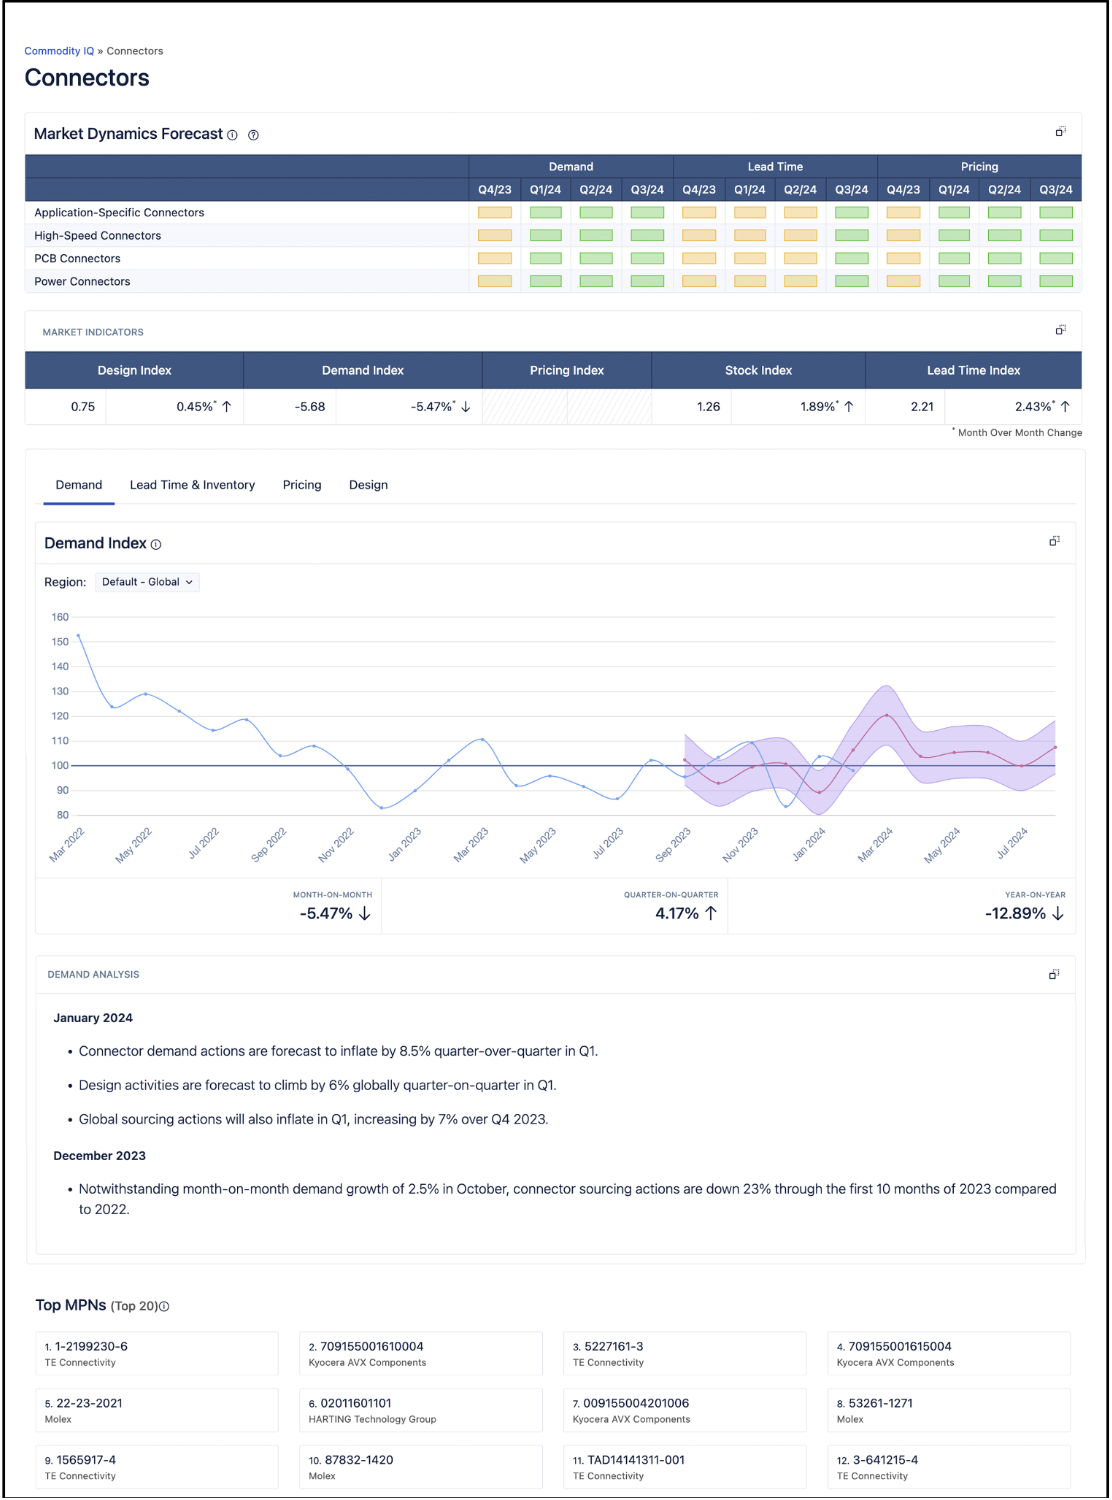
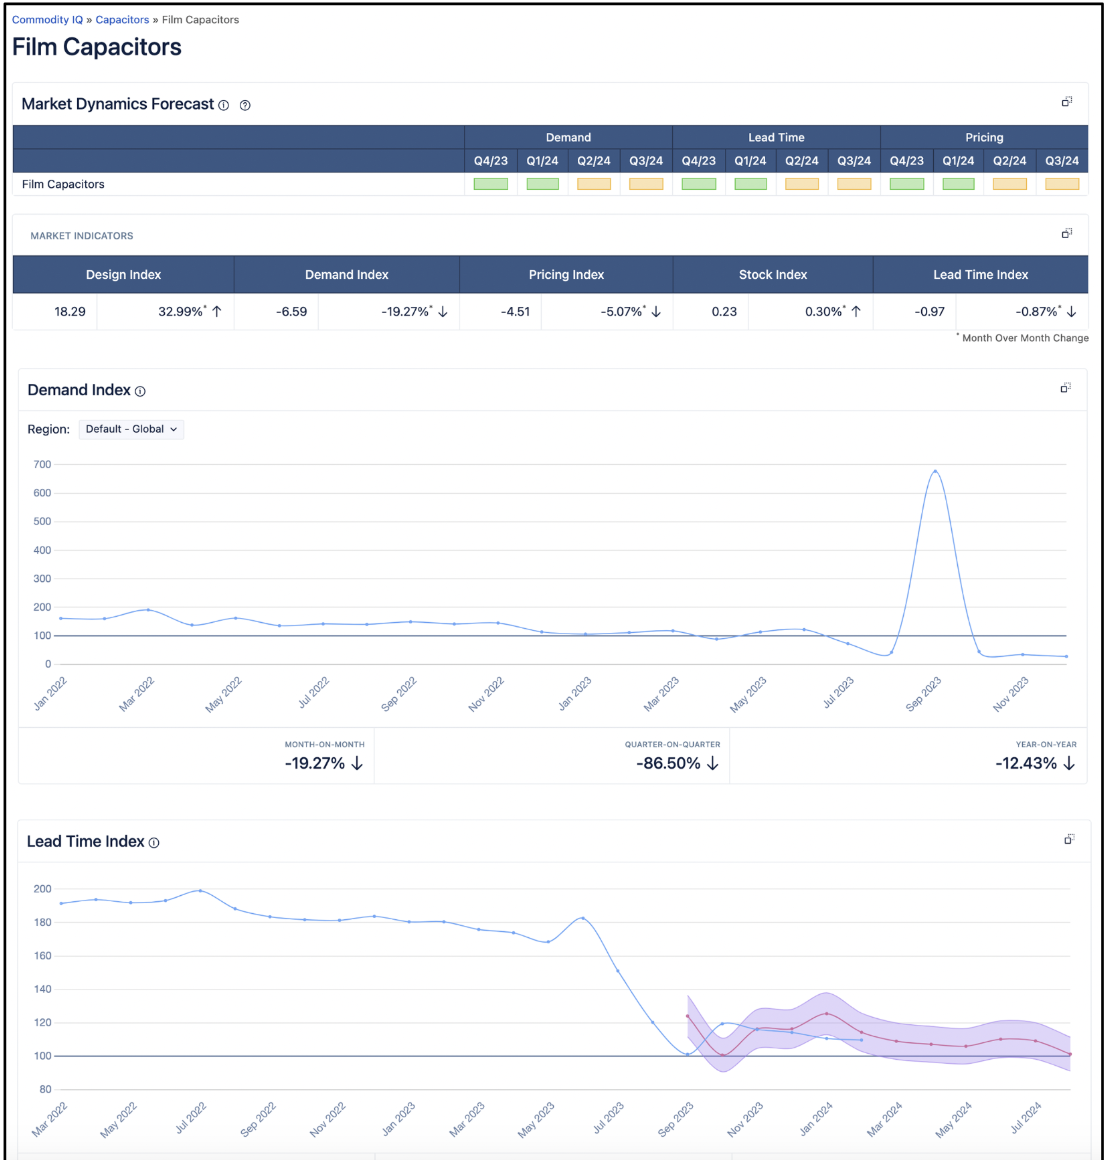
Update CIQ Sub-Sub Group Layouts
In the subgroup drill-downs (e.g., Film Connectors), the order of the charts have been changed and are now full-width to better display their trends. The new order, when data is available, is:
- Demand Index
- Lead Time Index
- Inventory Index
- Price Index
- Design Index
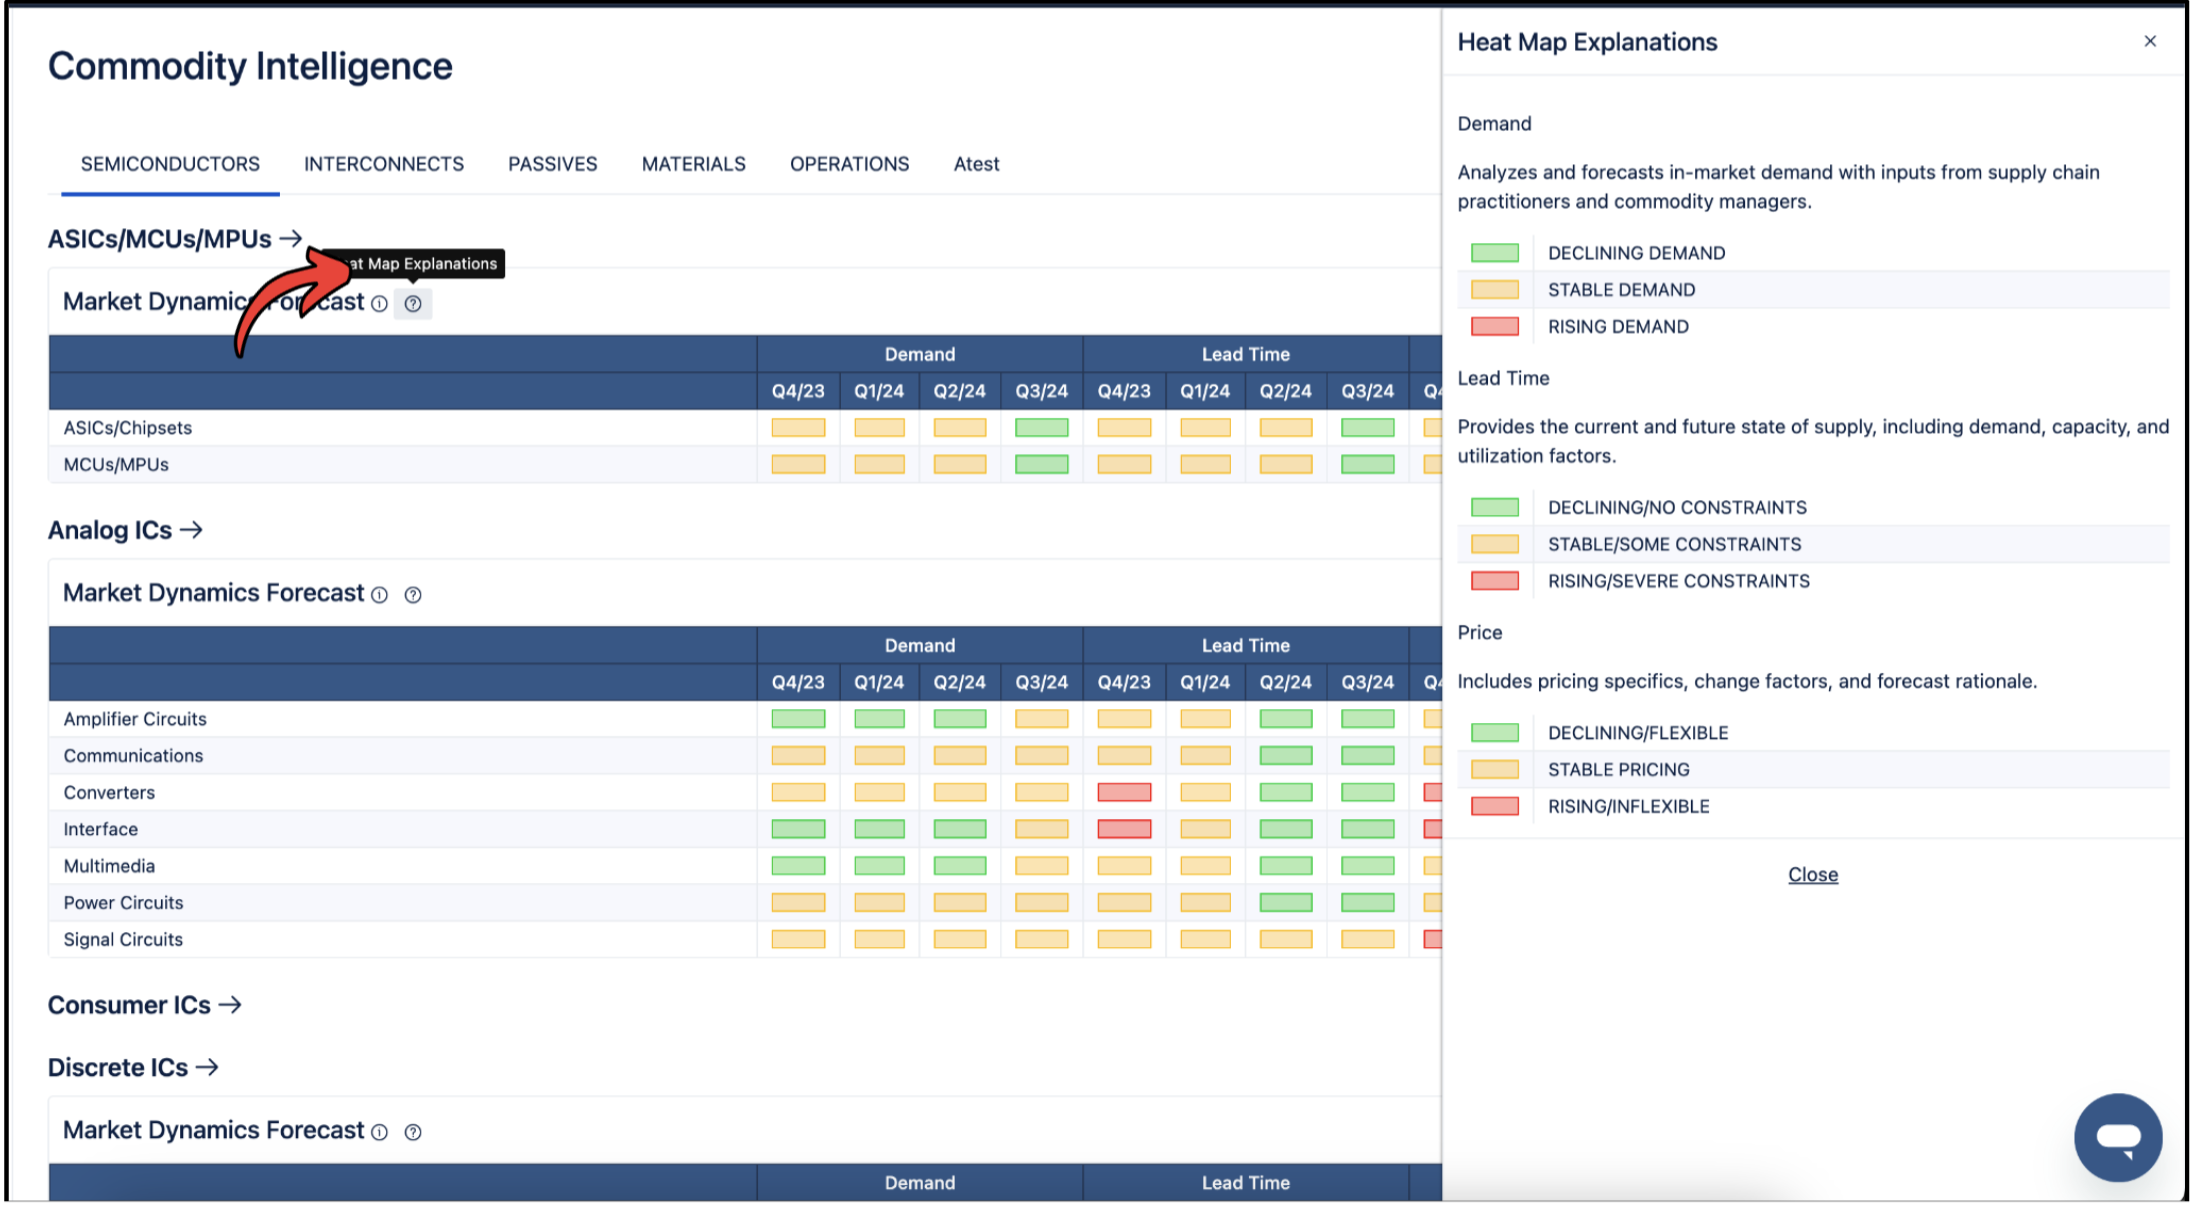
Updated Verbiage on At-Volume Heat Map
"At-Volume Forecast" is now labeled as "Market Dynamics," and the current "Market Dynamics" labels have been changed to "Demand." These changes ensure consistent language.
New Sidebar Legend for Market Dynamics Heat Map
When you click on the "?" next to the Market Dynamics title, a new slide-out sidebar will appear. This sidebar will display the meanings of the different colors on the heat map.
Tool-Tips
We've enhanced your experience by adding tooltips to specific sections. These tooltips are designed to help you better understand the data you're viewing. Simply hover over the "i" icon to see the explanation.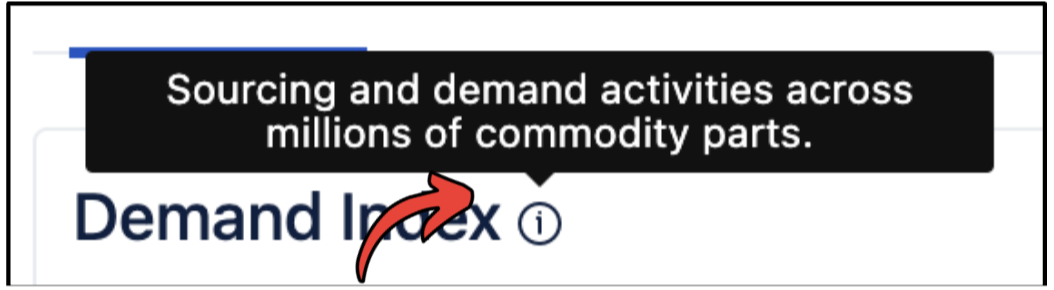
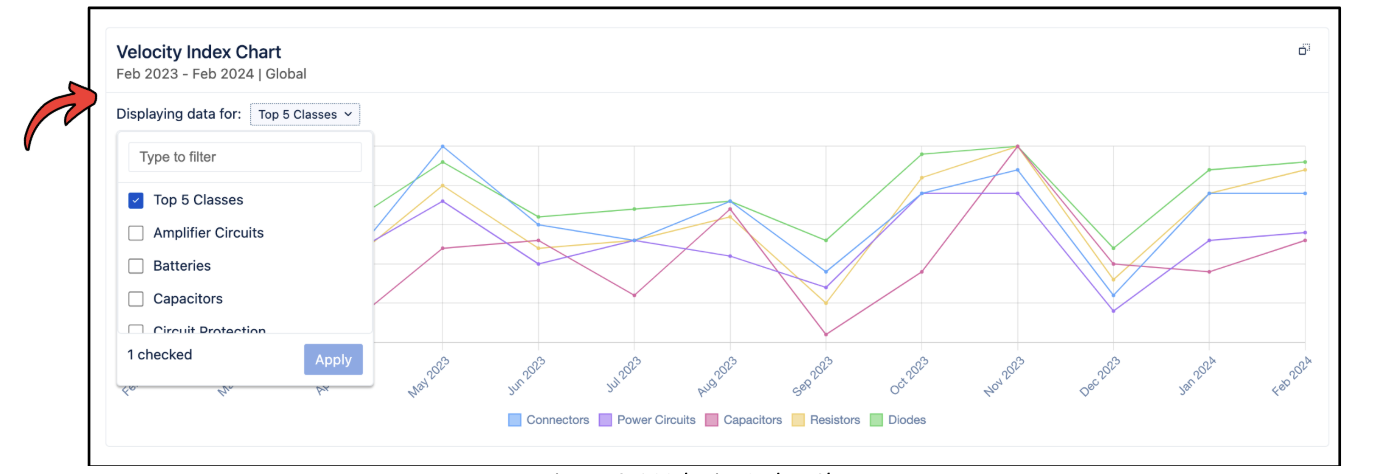
Velocity IQ
Make Charts Dynamic Based on Product Class Selection
Each chart previously displayed the top 5 matches based on the data in the table below. This update allows selection of 5 different product classes to display in the chart at the top of the table. This enhancement helps visualize the trend of specific classes of interest